Chicago Suburbs Tornado

A strong tornado struck areas west of Chicago on Sunday night, June 20. A quick set of maps and data to remind myself about the event & what to talk about when it comes up in class.

Where

Environment

The proximity sounding from KILX, with high CAPE, low LCL/LFC, and a very large 0-2 km hodograph but unidirectional winds above. All the convection-permitting models showed that this parameter space extended into N IL, to the convection itself (0-1 km SRH shown, but CAPE, other shear parameters, and therefore all the composite parameters demonstrated the same).

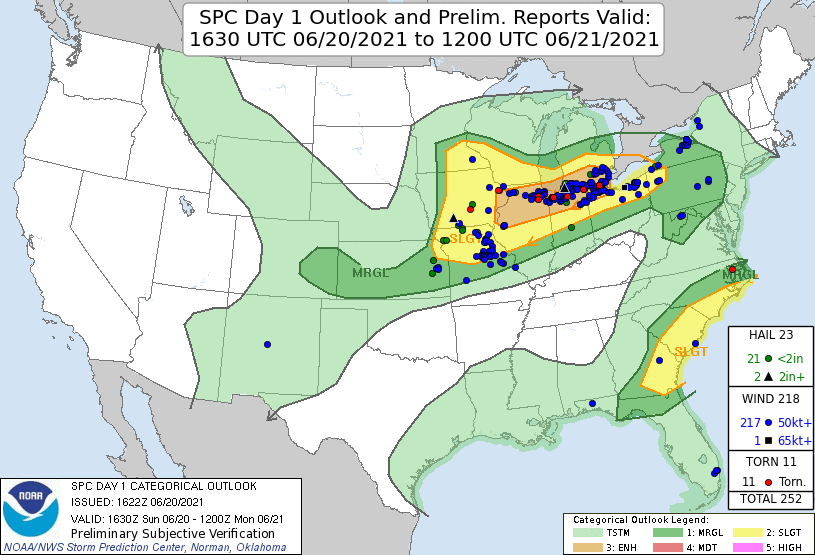
The tornado occurred smack in the middle of the “enhanced” risk region. (As of the time this post was written, the tornado report was not yet included in the SPC database — but it should appear eventually.)
Storm

A very obvious debris signature just before 11:30 p.m. CDT. At first, I thought it odd that the velocity couplet wasn’t gate-to-gate — as it usually appears — but at this distance the radar is sampling at only 700-800 feet off the ground. That’s the tornado itself.

https://twitter.com/NOAABrauer/status/1406830551571603457

A combination of power flashes, lightning, and maybe a beacon on top of a distant tower:

https://twitter.com/ddofinternet/status/1406830804261556230

The storm lofted debris to nearly 20,000 feet (at least one image showed possible lofting a few thousand feed higher). Based on radar climatology, the strength of the rotational signature and height of the likely debris indicated a high probability of EF2 or EF3 damage.

Damage

Earlier (different storm)

Bloomington, IN Flood — Damage

A major flood event occurred in downtown Bloomington on June 18 and 19. Here are some photos and videos of the ongoing flooding, mostly near the Kirkwood Avenue and Campus Crescent area (I think that’s the correct name). I’ve also included a series of damage photos and the Indianapolis Star story from the morning of the 19th.

https://twitter.com/MikeWoodsonFake/status/1406089082644611072

Added on 6 July, another set of great screenshots depicting the Kirkwood flooding as it happened:

Views from Elsewhere

Not part of the Bloomington flooding, but pretty pictures from elsewhere around Indiana on this day:

https://twitter.com/captainomorgano/status/1406065880774189056

Bloomington, IN Flood — Meteorology

A major flood event occurred in downtown Bloomington on June 18 and 19. Here’s an overview of just a couple pieces of the relevant meteorology.

Environment

A warm front lifted north through Indiana during the day, bringing dewpoints in excess of 70 F, and surface temperatures almost 10 F warmer than normal, even for June. The front would later stall and serve as the lifting mechanism for multiple rounds of storms.

Surface map from WPC, 19 UTC 18 June 2021

Deep atmospheric moisture, with precipitable water values that were 1-2 standard deviations above normal for June in Illinois and Indiana

The combination of extreme instability (see CAPE values in excess of 4000 J/kg, below) and a wind shear profile with only modest curvature (see the surface, 850 mb, and 500 mb wind “crossover” below) were favorable for multicell storms in the form of an MCS / squall line.

Radar loop to be inserted here later, but for now, here’s the 10 p.m. EDT radar image. These storms developed and moved almost parallel to Indiana Highway 46, between Terre Haute and Bloomington, for about three hours.

Precipitation Totals

From the CoCoRaHS network, consistent reports of 5 inches of rain, with one report in Ellettsville of 7.42 inches. At the Bloomington / Monroe County Airport, the report was 3.04 inches (I think), and the IU climate station reported 4.95 inches.

Climatology

https://twitter.com/indianaclimate/status/1406257208208375813

A smattering of damage photos in the next post.